TeeChart VCL for Borland/CodeGear/Embarcadero RAD Studio, Delphi and C++ Builder.
-
Zach A
- Newbie

- Posts: 10
- Joined: Mon Oct 05, 2020 12:00 am
Post
by Zach A » Thu Mar 27, 2025 3:49 pm
I am trying to contour elevations from a number of points.
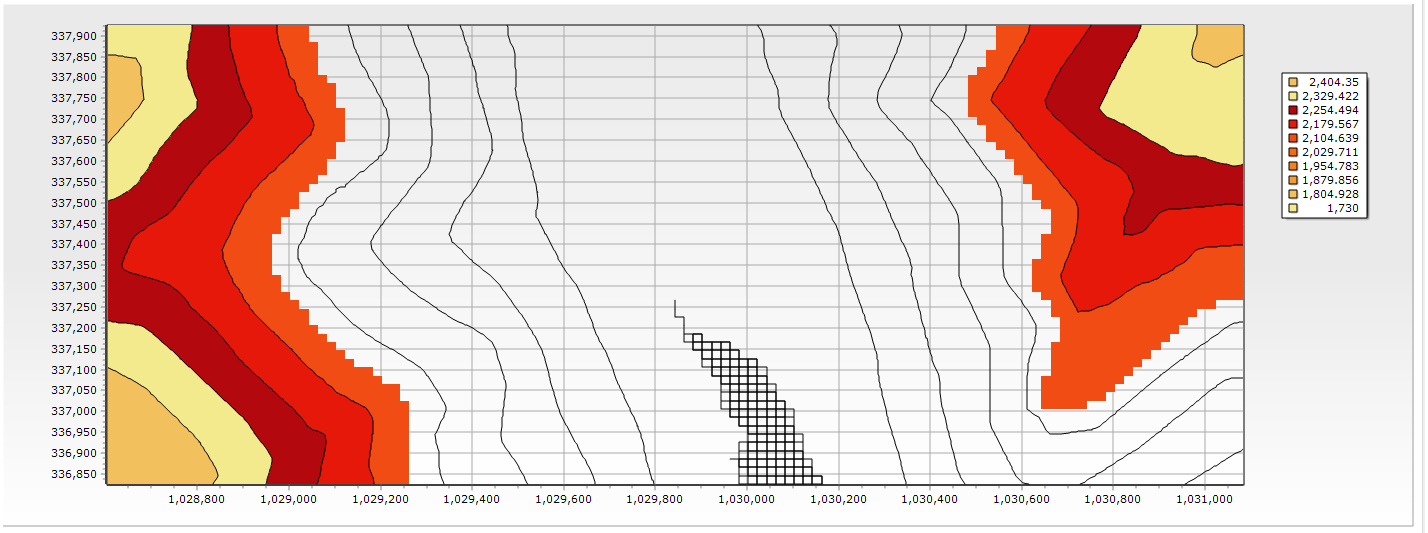
For some reason the contour fill breaks up as shown in attached image.
If
IrregularGrid := false then I get a blank grid.
Below is my code; I have excluded the query as it does not contribute.
I can provide the grid points by separate message as I can not post xlsx, csv or txt files.
Code: Select all
  with Chart1 do
  begin
    View3D := False;
    RemoveAllSeries ;
    Title.Clear ;
  end;
  MyContour := TContourSeries.Create(chart1);
  Chart1.AddSeries(MyContour);
  with MyContour do
  begin
    IrregularGrid := true;
    Filled := chkFillLevels.checked;
    BeginUpdate ;
  end;
  with QInsSC do
  begin
	//Formulate Query that will pull values from DB and populate fields[0] - fields[2] with xx, yy, zz values
    Active := true;
    first;
    icount := 0;
    while not eof do
    begin
      inc(icount);
      xx   := fields[0].AsFloat;
      yy   := fields[1].AsFloat;
      if not fieldbyName('GPD_Z').IsNull then
      begin
        zz := fields[2].AsFloat;
        MyContour.AddXYZ (xx, zz, yy,  '', clTeeColor);
      end;
      next;
    end;
  end;
  MyContour.EndUpdate ;

- contour_elevations.PNG (78.94 KiB) Viewed 1438 times
-
Yeray
- Site Admin

- Posts: 9660
- Joined: Tue Dec 05, 2006 12:00 am
- Location: Girona, Catalonia
-
Contact:
Post
by Yeray » Fri Mar 28, 2025 7:08 am
Hello,
Check
this to understand how the data is expected to be structured in this series.
-
Zach A
- Newbie

- Posts: 10
- Joined: Mon Oct 05, 2020 12:00 am
Post
by Zach A » Sat Mar 29, 2025 5:25 pm
Yeray, is your recommendation
a) to define the levels manually?
b) to assign the contour points to a surface?
c) ?
The link you provided mainly discusses a case where all the point values are the same (BTW has this fix been implemented? I run into a similar issue low performance issue a few months ago - but that is a different question)
Thanks
-
Yeray
- Site Admin

- Posts: 9660
- Joined: Tue Dec 05, 2006 12:00 am
- Location: Girona, Catalonia
-
Contact:
Post
by Yeray » Mon Mar 31, 2025 6:54 am
Hello,
I apologize if my previous explanation was not clear enough.
As you mentioned in your opening post, the code you provided is missing the actual data, which makes it impossible for us to pinpoint the exact issue. Without a simple yet complete example, it’s difficult to make an accurate guess about the problem.
In some cases, customers who encounter issues with 3D series tend to use highly irregular data to populate the series, which can lead to complications. This is why I directed you to an explanation regarding how data in TColorGrid and TSurfaceSeries should be structured for TeeChart to render it correctly.
I recommend trying to plot the same data using a TSurfaceSeries to check if it displays properly. Additionally, I would kindly ask you to share the data with us so we can examine it on our end as well.
Thanks in advance.
-
Yeray
- Site Admin

- Posts: 9660
- Joined: Tue Dec 05, 2006 12:00 am
- Location: Girona, Catalonia
-
Contact:
Post
by Yeray » Tue Apr 01, 2025 8:23 am
Hello,
I've received the data in an .xlsx file. I transformed it to a .csv and loaded to a chart as follows:
Code: Select all
uses Chart, TeEngine, TeeSurfa;

var Chart1: TChart;

procedure TForm1.FormCreate(Sender: TObject);
var MyContour  : TContourSeries;
    tmpLines   : TStrings;
    tmpFields  : TStrings;
    n          : Integer;
    xx, yy, zz : Double;
const AFileName='D:\Downloads\Zach\250401_Contour\grid_for_steema.csv';
begin
  Chart1:=TChart.Create(Self);

  with Chart1 do
  begin
    Parent:=Self;
    Align:=alClient;
    Color:=clWhite;
    Gradient.Visible:=False;
    Walls.Back.Color:=clWhite;
    Walls.Back.Gradient.Visible:=False;
    Legend.Hide;
    View3D:=False;
  end;

  MyContour:=TContourSeries(Chart1.AddSeries(TContourSeries));
  with MyContour do
  begin
    IrregularGrid:=True;
    Filled:=True;
    BeginUpdate;
  end;

  tmpLines:=TStringList.Create;
  tmpLines.LoadFromFile(AFileName);

  n:=1;
  while n<tmpLines.Count do
  begin
    tmpFields:=TStringList.Create;
    tmpFields.Delimiter:=';';
    tmpFields.DelimitedText:=tmpLines[n];

    xx := StrToFloat(tmpFields[0]);
    yy := StrToFloat(tmpFields[1]);
    zz := StrToFloat(tmpFields[2]);

    MyContour.AddXYZ(xx, zz, yy);

    Inc(n);
  end;

  MyContour.EndUpdate;
end;
And it looks correct for me here:

- contour.png (30.5 KiB) Viewed 853 times
Could you please try the code above in a new simple project to see if it also works fine for you?


